STEP 4. MATHS
1. Here we have examples of the children using maths skills and knowledge by making a display on the amount of sugar in different foods. We got our information from the HSE because we are a Health Promoting School. We made graphs using the information with Excel.
2. We made a a maths trail around the school.
3. We also did a survey on hot dinners. We get hot dinners in school every Tuesday and Thursday. Our teachers wanted to know what we thought so we made a survey of all the questions to find out what everyone thought.
2. We made a a maths trail around the school.
3. We also did a survey on hot dinners. We get hot dinners in school every Tuesday and Thursday. Our teachers wanted to know what we thought so we made a survey of all the questions to find out what everyone thought.
The Sugar Display
We used Microsoft Excel to make charts to show information about the amount of sugar in food. Here are some examples of our work...
|
| ||||||||||||
| sugar_cubes_in_biscuits_by_aine.xlsx |
More Charts with Excel
|
| ||||||||||||
School Maths Trail
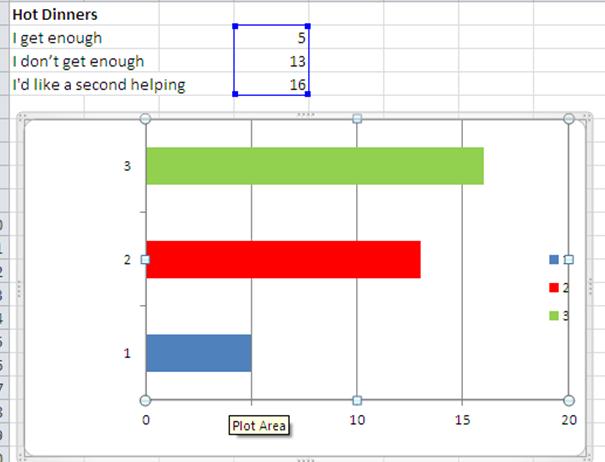
The Hot Dinner Survey
We did a survey on hot dinners. Our teachers wanted to know what we thought so we made a survey of all the questions to find out what everyone thought. We made some graphs from our results using Excel. Here are a couple of examples.
| hot_lunch_questionnaire_for_pupils.docx |
| childrens_replies.docx |
|

|